Checking access...
Premium Access Required
Which Diet Change Should I Ask For First?
About the AI Transparency Meter
This meter shows how much of this post's creation involved human versus AI contribution across several dimensions:
- Idea: The initial concept and question
- Concept: How the idea should be approached
- Argument: The reasoning and logic structure
- Sources: Finding and selecting references
- Structure: Organization and flow
- Base text: Initial draft writing
- Editing: Refinement and polishing
Each dimension is rated from 0% (fully AI-generated) to 100% (fully human). The overall percentage shown in the thermometer is the average across all dimensions.
Why show this? Transparency matters. AI is a powerful writing tool, but readers deserve to know how content is created. This meter is my commitment to being honest about the role AI plays in my posts.
A global land-use result, and a smaller question
Hannah Ritchie’s global scenario estimates that agricultural land use would fall from 4.1 billion hectares to 1 billion if the world adopted a vegan diet. Her analysis also identifies beef and dairy reductions as high-leverage changes in that global land-use model.1
That is a system-wide endpoint. My smaller question is: for one-shot outreach, should I ask for a beef cut or for the tracked vegan-style proxy I model here? The proxy changes seven listed food categories but excludes residual meat, butter, and cream; it is not a complete vegan diet.
Short answer: under the illustrative rates I test below—10% adopting the tracked proxy and 80% replacing all beef and veal—the beef-cut ask yields more expected one-year savings per 1,000 approaches under both audience-share assumptions. Those rates are hypothetical, not measured, and I do not claim that people find the beef request easier to accept. The tracked proxy still has the larger modelled savings per adopter.
If someone is willing and able to make the larger change, there is no reason to hold them back: more of the tracked animal foods replaced means more modelled savings. The “one attempt” assumption is only a way to compare outreach strategies when attention is limited. It is not a claim about how people behave.
What goes into the model
I use Statistik Austria’s 2025 annual food-balance quantities as a common per-person reference, not an individual diet. The meat table reports 9.6 kg of beef and veal, 32.8 kg of pork, 14.3 kg of poultry, and 1.9 kg of other species and offal per resident. The milk-products table reports 43.3 kg of drinking milk; a separate raw-milk row reports 8.0 kg for own consumption and direct sales, which I leave out. The tables also report 26.0 kg of other fluid dairy products, 27.8 kg of cheese, 8.5 kg of fish, and 15.4 kg of eggs.2 The balance estimates food availability, not what people actually eat, and does not separately measure household food waste.3
I use global 2010 GHG factors per kilogram and per 100 g protein from the Poore–Nemecek data processed by Our World in Data.4,5 The corresponding global land-use factors are per kilogram and per 100 g protein.6,7 The raw GHG downloads are included with the model inputs.8,9 The raw land-use downloads are included too.10,11
For the per-protein indicators, OWID uses Poore–Nemecek values where available and calculates missing nutritional-unit values from food-composition data. I therefore treat these as global processed indicators, not Austrian measurements.5,7
Each change replaces the whole basket quantity of that food: the beef cut, for example, replaces all 9.6 kg of beef and veal a year, not a partial cut. For animal foods other than the included fluid-milk quantities, I replace protein rather than product mass. In the plant-protein scenario, an equal share of the replacement protein comes from tofu, other pulses, and peas. In the alternative meat scenario, it comes half from pig meat and half from poultry. The included drinking milk and other fluid dairy quantities are replaced one-for-one by soy milk; cheese is protein-matched. These are explicit model rules, not menu plans.
I infer a product’s protein fraction from the paired GHG factors as GHG per kg ÷ (10 × GHG per 100 g protein).8,9 The rest of the diet stays fixed, so any constant term for “everything else” cancels when I compare changes. I leave it out rather than imply an Austrian measurement that I do not have.
The per-adopter carbon deltas below are calculated from the Austrian balance and GHG tables.2,8,9 The land deltas use the corresponding balance and land-use tables.2,10,11
The central basket also excludes the 8.0 kg raw-milk row, the 1.9 kg residual meat category, butter (5.2 kg), and cream (7.5 kg). The 2025 table groups other species and offal together, and the matched OWID factor tables have no butter or cream rows.2,8,10 Treating all residual meat as lamb raises the tracked endpoint to 2,044.5 kg CO₂e per person-year.2,8,9 Its land-use indicator rises to 5,554.2 m².2,10,11 This is a high-impact scenario, not a strict upper bound, because the species mix is unknown.2 For fish I use the farmed-fish factor, and for other fluid dairy I use milk’s factor and the one-to-one soy-milk rule. Those simplifications matter.
What the individual trade-off looks like
My chosen path is: cut beef first (one category), add milk and cheese changes (two more), then change pork, poultry, fish, and eggs (four more).
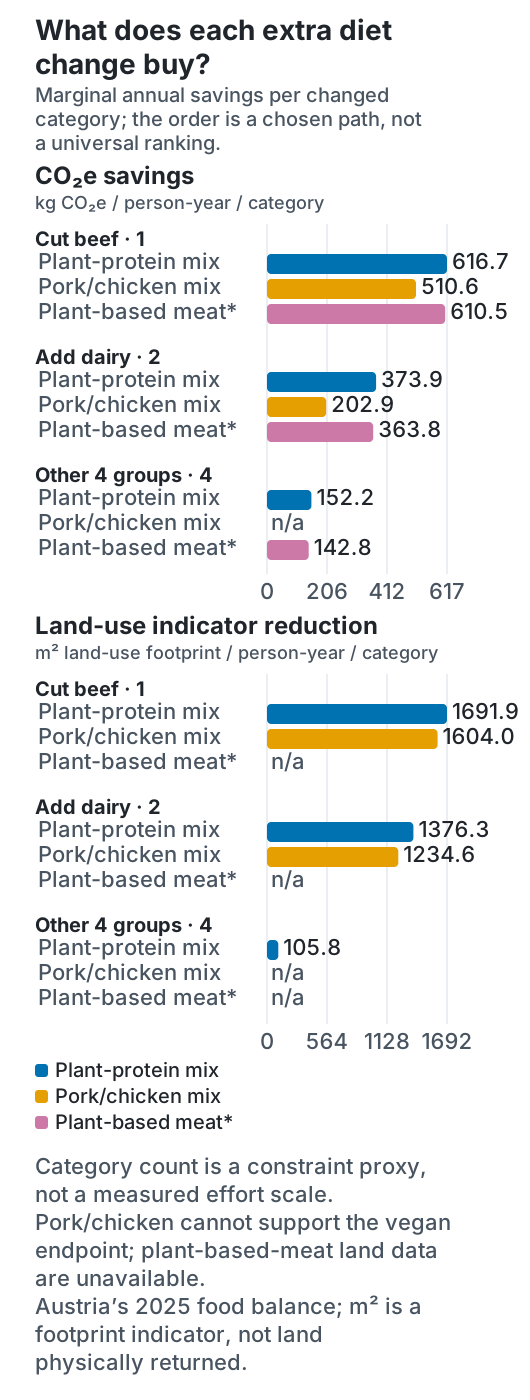
Axes: The top panel shows annual CO₂e savings in kg per person-year per changed category; the bottom one shows the land-use footprint indicator in m². Bars compare plant-protein, pork/chicken, and plant-based-meat replacement assumptions. Look for: the beef step is the largest plant-protein step on both measures; later steps are smaller. Takeaway: results depend on the replacement and chosen sequence. Category count is only a request-scope proxy, not a measure of inconvenience.
All entries in the table are modelled annual savings relative to the same food-balance basket, not total diet footprints.2,8,9 Land values use the separate land-use intensity tables.10,11
| Ask (path or branch) | Categories | CO₂e, kg/yr | Land, m²/yr |
|---|---|---|---|
| Cut beef only (step 1) | 1 | 616.7 | 1,691.9 |
| Dairy only (branch) | 2 | 747.7 | 2,752.6 |
| Beef + dairy (step 2) | 3 | 1,364.4 | 4,444.5 |
| Vegetarian-style: beef, pork, poultry, fish (branch) | 4 | 1,172.1 | 2,091.8 |
| Tracked vegan-style proxy (endpoint) | 7 | 1,973.2 | 4,867.8 |
The tracked vegan-style row is a proxy, not a complete vegan diet: butter, cream, and the residual meat category are outside the central calculation. The m² figure is a land-use footprint indicator, not a claim that this area would be physically released or restored.6,10
The order matters: “Dairy only” and “Vegetarian-style” are branches from the baseline, not steps in the beef-first path. I chose beef first to show one marginal path; reordering the categories changes the marginal values, even if the endpoint stays the same.
What changes when I change the substitute?
A beef cut does not have one fixed benefit independent of the replacement. Replacing its protein with the pork/poultry mix saves 510.6 kg CO₂e per person-year.2,8,9 Its land-use indicator falls by 1,604.0 m².2,10,11 With the plant-protein mix, the corresponding values are 616.7 kg CO₂e and 1,691.9 m².2,8,10 The plant mix is larger on both measures in this model.
Because the pork/poultry mix contains meat, its results apply only to the beef-cut comparison; they cannot represent a vegetarian or vegan endpoint.
The alternative-meat and beef-herd assumptions matter too; I keep those sensitivity details below for readers who want them.
The one-attempt campaign model
For strategy j and environmental measure m, I calculate:
Expected annual savings = N × sⱼ × qⱼ × r × Δⱼ,ₘ
N is the number of approaches to the survey-defined population used for that strategy; s is a survey-based share proxy for whom the ask applies; q is the chance, after one attempt, that someone in that group makes the whole modelled change (a partial change would need a smaller Δ); r is the fraction of a year the change is retained; and Δ is the per-adopter annual savings. The examples use N = 1,000 and r = 1.
In my main scenario, I set qV = 0.10 for the tracked vegan-style proxy and qB = 0.80 for cutting beef. These are hypothetical rates, not survey findings.
To estimate reach, I use two Austrian surveys as separate proxies. Smart Protein’s 2023 online survey included 750 Austrian consumers, all over 18 and responsible for household grocery shopping.13 It reports 48% omnivores and 37% flexitarians.13
I use 48% omnivores as a narrower target-audience proxy and 85% (omnivores plus flexitarians) as a broader one. They define two alternative reach assumptions—not a statistical interval or a direct measure of beef-specific consumption.13
The UBA’s FAQ describes the monitor’s target population as Austrian residents aged 16 and older and reports 2,022 valid interviews.14 The report estimates that 3% of respondents fall in the combined strict-vegetarian-or-vegan category based on food-frequency answers. That share varies by social milieu: 8.1% in one milieu and 0.8% in two others.15 I use 97% as a conservative lower-bound target-audience proxy for a vegan ask: the combined category does not distinguish vegetarians from vegans, so the share not already vegan could be higher.15 The FAQ notes that its German-only questionnaire may under-represent people with limited German proficiency and that weighted survey results still approximate, rather than perfectly represent, the population.14 I therefore treat 97% as a survey proxy, not an exact census share.15,14
These surveys cover different populations and use different methods, so their audience shares are alternative proxies, not a time series or a single population mix.13,15 Each one-shot column represents 1,000 approaches to the population associated with its own proxy. Every group gets the same per-adopter savings, those of the average resident’s basket. If the people a beef ask reaches eat more or less beef than average, or the vegan ask’s audience eats less meat and dairy, the ranking can shift; I have no group-specific consumption data to test that. The model combines the 2025 basket with the cited GHG and land-use factors to calculate per-adopter deltas.2,8,10 The q values remain illustrative.13,15
| Scenario | Vegan-style | Beef, low reach | Beef, high reach |
|---|---|---|---|
Audience-share proxy s |
0.97 | 0.48 | 0.85 |
One-attempt success q |
0.10 | 0.80 | 0.80 |
| Expected changes per 1,000 approaches | 97 | 384 | 680 |
| CO₂e, one year | 191.4 t | 236.8 t | 419.4 t |
| Land, one year | 472,177 m² | 649,692 m² | 1,150,497 m² |
Under those assumptions, the beef-cut ask wins on both measures, even though the vegan-style change saves more per successful adopter. If I lower the beef-cut success rate to 20% while keeping vegan at 10%, the vegan ask wins. If I raise vegan success to 30% while beef remains at 80%, the vegan ask also wins.
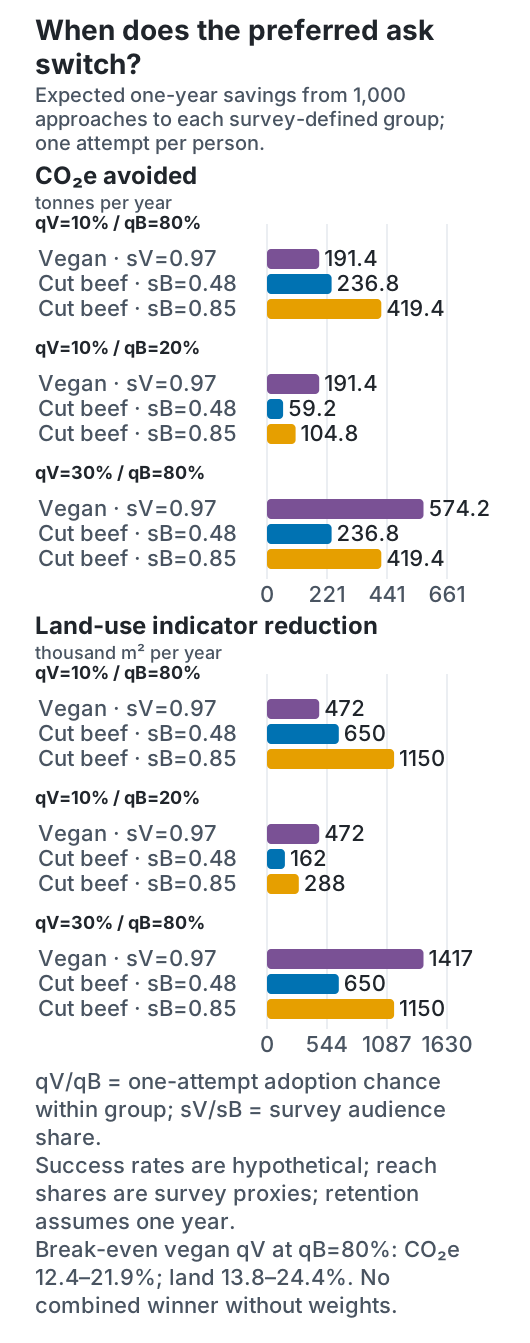
Axes: The top panel shows expected annual CO₂e savings in tonnes; the bottom one shows the land-use footprint indicator in thousand m², each for 1,000 one-attempt approaches to its survey-defined group. Look for: beef leads in the 10%/80% case; the vegan-style ask leads when beef success falls to 20% or vegan success rises to 30%. Takeaway: the winner depends on assumed reach, adoption, and one-year retention; this is a scenario, not a persuasion forecast.
The break-even equation compares one-year per-adopter savings and survey-based audience-share proxies.2,13,15 At qB = 0.80, sV = 0.97, and sB = 0.48–0.85, vegan qV must reach 12.4–21.9% to match the beef ask on CO₂e.8,9 For the land-use indicator, it must reach 13.8–24.4%.10,11 The 10% vegan scenario falls below both thresholds; the 30% scenario exceeds them.
What if grazing land and leftover feed count?
Two objections come up whenever footprints like these are compared. Much of the land behind beef and milk is permanent grassland, and some animal feed is a by-product such as straw, bran or distillers’ grains. I checked both against the farm-level records behind the global factors.16
- Grassland. In those records, permanent pasture is about two-thirds of beef’s land footprint and three-quarters of milk’s, and almost none of pork’s, poultry’s or eggs’. Permanent pasture is a land-use category, not a soil survey: some of it could be ploughed. Treating all of it as unusable for crops is therefore the most generous reading for livestock. On that reading, the beef cut saves about 500 m² a year instead of about 1,700 m², and the tracked proxy about 1,300 m² instead of about 4,900 m². The CO₂e results do not change.
- Leftover feed. By-products make up about 8% of the listed feed for beef and under 3% for the other foods, and feed causes a sixth to two-fifths of those foods’ emissions (the records do not split out farmed fish, so fish gets no credit). The records do not show what would happen to those by-products otherwise. My credit assumes that all of them would be wasted and scales feed-stage emissions by their share of dry matter, a simple assumption rather than a measured value. It lowers the modelled CO₂e savings by about 1% for beef and less for the rest. Cheese takes milk’s shares, because the records do not split it out. The credit leaves the land results unchanged.
Neither changes which ask comes out ahead. Counting only crop-suitable land, the vegan qV needed to match the beef ask on land rises from 13.8–24.4% to 15.2–26.9%, so the beef-first case gets slightly stronger on that measure. Grassland that is no longer grazed is not worthless land either: it can store carbon as vegetation grows back, which this crop-only view leaves out.
Can I call one strategy “best”?
Only after saying what I want to optimize. I can maximize expected CO₂e savings, maximize expected land-use-indicator savings, or choose weights and combine them. I do not choose those weights for the reader. In the scenarios above, both measures pick the same strategy; other inputs could split them.
Along the chosen path, beef has the highest marginal savings per changed category in the comparisons with available data. That is a local result under these replacement assumptions, not a measured consumer-constraint optimum; that would require a defensible burden or adoption curve and a choice about how to weigh CO₂e against land use.
The audience-share proxies also matter. If a campaign screens people before asking, the measured share within its selected group may differ; the formula should use the campaign’s actual target-audience proportion. If it can ask again, lasts longer than a year, or sees adoption fade, N, q, or r should change too. The model is deliberately small enough that those assumptions are visible.
What I left out
- Global GHG factors are not Austrian life-cycle assessments; local production, feed, and energy may differ.4,5
- The matching land-use factors are global averages too, so the m² score is not a local acreage prediction.6,7 They also count grazing land that could not grow crops; the section on grazing land shows the crop-suitable share.
- Balance-derived food availability is not individual intake. Some people eat far more or less than the per-capita basket.3
- The plant-mix replacement is equal-protein, not equal-calorie or nutritionally complete.
- Other fluid dairy is treated as milk and replaced one-for-one by soy milk; fish uses a farmed-fish factor; butter and cream are omitted.
- I do not model health, cost, taste, preparation time, nutrition quality, animal welfare, biodiversity, water use, land restoration, or long-term adoption.
- The one-attempt
qrates are hypothetical inputs, not measured adoption estimates; the diet surveys provide category shares, not conversion probabilities.13,15 - The savings are footprint differences: they assume that each kilogram not eaten is a kilogram not produced. In real markets, lower demand can also lower prices, others may buy more, and part of the reduction may be offset, so the emissions actually avoided may be smaller; how much depends on the market and the scenario. I have not modelled that market response; it would shrink the totals for both asks, and I don’t know whether it would change which one leads.
To turn this from a scenario into a strategy recommendation, I would first measure beef-specific eligibility and one-attempt adoption rates in a real, consent-based pilot. I would also replace the global footprint factors and assumed beef-herd mix with Austrian-specific evidence if those data became available.
So, what should I ask for first?
Under my illustrative one-attempt rates, the ask to replace all beef and veal produces a larger expected footprint reduction than the tracked vegan-style proxy under both audience-share assumptions. That is a conditional scenario result, not evidence that people find the beef request easier or will accept it more often. If the proxy’s assumed adoption rate rises to 30%, or beef’s falls to 20%, the model favors the proxy. Which ask comes out ahead depends on reach, adoption, replacement and retention.
If someone is willing to make the larger change, I would encourage it. A narrower ask is the better first move in this model only when its assumed adoption rate compensates for its lower per-person impact.
AI assistance
I supplied the question, initial sketch, and one-attempt example. AI assistance retrieved and checked sources, implemented and tested the model, generated the figures, and drafted and revised this text. The contribution-meter values are provisional; final human author review remains open.
-
Hannah Ritchie, Our World in Data, global land-use scenarios for diets. Source. ↩
-
Statistik Austria (2026). Versorgungsbilanzen für tierische Produkte 2025. PDF · publication page. ↩ ↩2 ↩3 ↩4 ↩5 ↩6 ↩7 ↩8 ↩9 ↩10 ↩11 ↩12 ↩13 ↩14 ↩15 ↩16 ↩17
-
Statistik Austria, Standard documentation: supply balances. Source. ↩ ↩2
-
Our World in Data, greenhouse gas emissions per kilogram of food product. Source. ↩ ↩2
-
Our World in Data, greenhouse gas emissions per 100 grams of protein. Source. ↩ ↩2 ↩3
-
Our World in Data, land use per kilogram of food product. Source. ↩ ↩2 ↩3
-
Our World in Data, land use per 100 grams of protein. Source. ↩ ↩2 ↩3
-
OWID download, Poore–Nemecek GHG emissions per kilogram. Source. ↩ ↩2 ↩3 ↩4 ↩5 ↩6 ↩7 ↩8 ↩9 ↩10 ↩11 ↩12 ↩13
-
OWID download, Poore–Nemecek GHG emissions per 100 g protein. Source. ↩ ↩2 ↩3 ↩4 ↩5 ↩6 ↩7 ↩8 ↩9 ↩10
-
OWID download, Poore–Nemecek land use per kilogram. Source. ↩ ↩2 ↩3 ↩4 ↩5 ↩6 ↩7 ↩8 ↩9 ↩10 ↩11 ↩12
-
OWID download, Poore–Nemecek land use per 100 g protein. Source. ↩ ↩2 ↩3 ↩4 ↩5 ↩6 ↩7 ↩8
-
LLU institutional record for Mejia et al. (2016), meat analog environmental impacts. Source. ↩ ↩2
-
Smart Protein, Austrian consumer attitudes and behaviours report 2024 (survey data 2023). Source. ↩ ↩2 ↩3 ↩4 ↩5 ↩6 ↩7
-
Umweltbundesamt, FAQ on Human-Environment Monitor methodology. Source. ↩ ↩2 ↩3
-
Federal Environment Agency Austria, Environmental awareness in Austria: Human-Environment Monitor 2026. Source. ↩ ↩2 ↩3 ↩4 ↩5 ↩6 ↩7
-
Poore, J. & Nemecek, T. (2018), full Excel model behind the global factors, Oxford University Research Archive, Database sheet, rows weighted by the model’s world weights; my extraction of the permanent-pasture, feed-stage and by-product shares. The source pools beef-herd and dairy-herd beef. doi:10.5287/bodleian:0z9MYbMyZ. ↩