The 5-Minute Surrender Fallacy: Why Early MOBA Leads Are Not Destiny
About the AI Transparency Meter
This meter shows how much of this post's creation involved human versus AI contribution across several dimensions:
- Idea: The initial concept and question
- Concept: How the idea should be approached
- Argument: The reasoning and logic structure
- Sources: Finding and selecting references
- Structure: Organization and flow
- Base text: Initial draft writing
- Editing: Refinement and polishing
Each dimension is rated from 0% (fully AI-generated) to 100% (fully human). The overall percentage shown in the thermometer is the average across all dimensions.
Why show this? Transparency matters. AI is a powerful writing tool, but readers deserve to know how content is created. This meter is my commitment to being honest about the role AI plays in my posts.
Every MOBA player has been there. Five minutes into the match, your team is down two kills and 1000 gold. Someone types “/ff” in chat. “It’s over,” they say. “They’re too far ahead. Just surrender and move on.”
But is it actually over? Or is the 5-minute surrender a cognitive bias—part confirmation bias, part distorted win-probability perception—masquerading as strategic wisdom?12
Part of the urge to surrender may also be simple loss aversion: being behind feels worse, and more final, than the actual odds justify.34
The Origin Story
It started with a game I played with a friend. We lost. It was not pretty. But what stayed with me was not the loss itself. It was what he said after:
“The game was over at 5 minutes.”
That sentence sounds obvious in ranked chat. But mathematically, it hides a strong claim: that once a team gets ahead early, the rest of the match is basically fixed.
I do not think that is how MOBAs work.
A MOBA is not deterministic. A stronger team does not win every fight. A better player does not win every duel. A team with a gold lead does not win every game. What changes is not certainty, but likelihood.
The right question is not:
- “Who is guaranteed to win?”
The right question is:
- “How much does each side’s chance to win change, given the current state?”
That is the motivation for the model in this post.
At the center is a single quantity: fighting power.
Think of fighting power as a team’s match-state strength at a given moment. It is not a promise of victory. It is a way to map game state into win probabilities.
Higher fighting power means you win contests more often, not always. Lower fighting power means you still win sometimes, just less often. The gap between teams sets the odds of who takes the next objective, wins the next fight, and eventually closes the match.
So the model starts with this principle:
- Match outcomes are contingent rather than fixed
- Outcomes are probabilistic
- Advantages shift odds, not destiny
From that view, two main characteristics define MOBA dynamics:
1. The Snowball Effect
Winning a bout usually gives resources (gold, tempo, map control), which increases future fighting power. That increased fighting power then raises the probability of winning subsequent bouts. In short: success makes future success more likely.
2. Contingent Bouts Driven by Skill Expression and Game-State Advantage
Each bout (teamfight, objective contest, key pick) resolves under uncertainty, not certainty. But that uncertainty is not arbitrary noise. It is shaped by relative fighting power, which itself depends on baseline skill and in-game advantage. Better teams win more often, not always.
The next sections lay out the model, step by step.
Modeling MOBAs
This model breaks MOBA gameplay into 50 rounds. Each round stands for one meaningful event: a skirmish, gank, or objective fight. To feel like a MOBA, the model needs to capture three things: game flow and progression, how matches end, and how advantages build.
Both teams receive some passive income and fight over extra income. Those resources create advantages that help decide later rounds. The game does not end at a fixed time; instead, it can end with increasing probability as the match goes on. And the chance of winning any given round should rise with both skill (Skill Expression) and in-game advantage (Snowball Effect). That advantage should also level off, because item slots put a ceiling on how much power gold can buy.
In the model, each “player” stands for a full five-person team, so I use the word team throughout.
The Three-Phase Round Cycle
Both players start with $1{,}736g$ to represent an initial item purchase.
After that, every round follows a strict three-phase cycle. This structure mirrors real MOBA gameplay where passive income, contested objectives, and potential game-ending moments occur in sequence.
1. Income Phase - Both teams receive a fixed base income ($I_{\text{base}} = 417g$).
2. Event Phase - Teams fight for contested gold ($I_{\text{event}}$) in bouts. Later bouts should be worth more than earlier ones.
3. Game-End Trigger - The game ends or continues to the next round. Game end chance should depend on game progression and the gap between leading and trailing team.
The next section will work out more thoroughly the key properties of these phases:
- How much gold is each event worth?
- How is the winner of each round decided?
- How is the game end probability determined?
Event Income (Quadratic Scaling)
The desired behaviour is achieved by the following function for amount of contested gold $I_{\text{event}}(r)$:
\[I_{\text{event}}(r) = e + s \times r^2 = 278 + 8.333r^2\]Late-game events are worth significantly more gold. The quadratic scaling factor ($s = 8.333$, applied to $r^2$) creates a sharp acceleration in event value - an event at round 50 is worth $21{,}111$g, versus just $286$g at round 1. This serves two purposes: it keeps early-game gold differences small (preventing early leads from being decisive), and it makes late game bouts decisive.
Choosing an event winner: Bradley-Terry Win Probability (Squared)
The concept of quantifying the power of a player or team, and describing the win probability as the ratio of power is also known as the Bradley-Terry model 5.
The Bradley-Terry model estimates the probability that one player or team wins against another based on their relative strengths or ratings. The win probability for player A against player B is given by:
\[P(A \text{ beats } B) = \frac{\text{strength}_A}{\text{strength}_A + \text{strength}_B},\]where strengths are positive values representing skill or ability. This model is widely used in sports and other competitive settings to predict match outcomes and rank players or teams.
Lanchester’s laws, particularly the square law, imply that combat power compounds nonlinearly rather than linearly, meaning a numerical advantage translates into a disproportionately higher chance of victory. The square law states that fighting strength is proportional to the square of the number of combatants in all-against-all combat, so a 2:1 force ratio can yield a 4:1 win probability, reflecting this compounding effect 6. I believe this to be applicable to the team fighting dynamics of MOBAs. In order to reflect that dynamic, instead of using a linear proportion of $\text{FP}$ for the probabilistic weighting, we should be using $\text{FP}^2$.
Therefore round outcomes use squared fighting power:
\[P(\text{Win}) = \frac{\text{FP}_{\text{you}}^2}{\text{FP}_{\text{you}}^2 + \text{FP}_{\text{enemy}}^2}\]Now we just need a way of determining a teams game state of power.
Fighting Power
Fighting Power is the central quantity that drives all outcomes:
\[\text{FP} = \text{Skill} \times T(\text{Gold})\]As gold should have a saturation of how much power you can draw from it, we need to create a function, that maps a given amount of gold onto a percentage of how much utility is given - where 0 gold should be 0%, turning point amount of gold should be 50%, and full build should be 100% - that is $T(G)$, the logistic utility map.
\[T(G) = \frac{1}{1 + e^{-k(G - G_0)}}\]Gold provides logistic utility - not linear. Starting with 1,736g represents a basic item purchase. Your next few thousand gold provide a power spike, but returns diminish as you approach the item cap. At maximum build (~97,000g in this model), additional gold adds very little extra power. This S-curve represents the utility provided by any given amount of gold.
Game-Ending Probability (Shifted Quadratic Hazard)
Game end is not modeled as a fixed round cap. Instead, it is treated as a contingent event that becomes more likely under certain conditions. In a real MOBA, a match usually ends when one team converts the current state into a decisive sequence: winning the fight that matters, taking the key objective, breaking the base, and actually closing the game.
To capture that, the model performs an end-check after each round. That check is governed by the hazard function $P_{\text{end}}(r, L)$, where $r$ is the round number and $L$ is the relative lead. Early in the game, this probability is close to zero, because even a won skirmish rarely ends the match outright. Later in the game, or when one team has built a large lead, the probability rises: the current round is more likely to be the one that truly decides the game.
If the trigger fires, the model treats that moment as a final closing contest. The stronger team is favoured to convert its advantage, but not guaranteed to do so. This is important because it reflects a real feature of MOBAs: late-game matches often hinge on one Baron fight, Fire Giant fight, or base siege, yet even those pivotal moments remain probabilistic rather than fully predetermined.
\[P_{\text{end}}(r, L) = t^2 \times 0.016 + t \times 0.16 \times \frac{L}{m + L}\]P_end(r, L) = t²·0.016 + t·0.16·L/(0.4+L) - game-end probability across all (round, lead) pairs
x = round (10–50) · y = relative lead (0–300%) · colour = P_end
So What: Analysing the Model’s Behaviour
So far, I have tried to capture the basic features that make MOBAs feel like MOBAs. From those features, I built a model that is as simple as possible while still matching the core game dynamics 7.
If that setup is broadly reasonable, then the model’s behaviour should tell us something useful about real matches. The next step is to test it and see what patterns appear.
Interactive Lab 1: Single Game Trajectory
To understand how a single game unfolds under the model, run one simulation and examine the detailed trajectories. Adjust the skill levels and optional headstart to see how different starting conditions affect the game dynamics.
This runs a single game with your chosen parameters. Each chart shows a different perspective on how the game evolves round-by-round.
Gold Accumulation: The two lines show total gold earned by each team over time. Both lines rise continuously as income compounds round-by-round. A widening gap between them signals a snowball effect - one team pulling ahead and becoming harder to catch. Equal skill with no headstart will usually keep them close early, then drift apart as contingent events start falling one side's way.
Fighting Power² (FP²): FP² = (skill × T(G))², where T(G) is the logistic utility of gold. This is the quantity that enters the win-probability formula for each event - in other words the proportion between the red and blue value discerns the event win chance for both teams. The dashed lines show each team's theoretical saturation ceiling - the FP² they approach at very high gold. Notice that FP² grows faster when gold is already high (logistic acceleration) and flattens near saturation. The gap between the two FP² curves represents the magnitude of the lead.
Event-Win-Chance (pA): pA = FP²(A) / (FP²(A) + FP²(B)) - A's probability of winning each individual combat event this round. Starts near 50% when gold is equal. Watch for how quickly it departs from 50% and whether it ever crosses back: a crossing back towards 50% signals a comeback attempt, while a sustained climb towards 80–100% indicates dominance. The final value when the line ends marks the round the game concluded.
Distribution of Event-Win-Chances: A histogram counting how many rounds were spent at each pA level. A tall bar near 50% means the game was competitive for most of its duration. Bars piling up towards the extremes (near 0% or 100%) indicate one-sided dominance. Most real games should show a spread - some close rounds early, then shifting as a lead builds. Compare games with different skill gaps to see how quickly the distribution shifts.
Absolute Gold Lead (A − B): The raw gold difference each round. Positive values mean A is ahead; negative values mean B leads. Unlike relative lead, absolute lead naturally grows over time even in balanced games because both teams accumulate gold - the total pot expands every round. A line that crosses zero shows a lead reversal. This metric is intuitive but can be misleading late in the game: a 2,000-gold lead at round 5 means much more than at round 40 when both teams have 30,000+ gold.
Relative Gold Lead (%): (Gold A − Gold B) / min(Gold A, Gold B) × 100. This normalises the lead by the trailing team's wealth, making it meaningful regardless of how far the game has progressed. A 50% relative lead means the leader has 50% more gold than the trailer. This is the figure that directly feeds the game-ending hazard in the model - a large relative lead late in the game makes the game very likely to end soon. A value fluctuating near 0% throughout means a genuinely even contest.
Running single simulations gives us a general understanding of how games play out. First, I would like you to ask yourself if this seems like an accurate representation. Naturally I would like to claim it does. It also becomes apparent how players will organically arrive at the deterministic account, after running a few games, you will observe that games often seemingly are either quite definitively won by the leading player (often that is whoever can acquire a significant lead first), or a tense head-to-head fight throughout. But that kind of anecdotal evidence is not enough to support a deterministic view. To see the pattern more clearly, we need to run the model in batches.
Interactive Lab 2: 10-Game Overlays
Running multiple games reveals the variance in outcomes. This lab runs 10 games simultaneously and overlays their trajectories, with visual markers showing when each game ended and who won.
Each line represents one game. Notice the spread in outcomes even with identical starting parameters - this is the probabilistic nature of MOBAs at work.
Color coding: Each game has its own colour. Solid lines are games A won; dashed lines are games A lost. The green shaded zone (above 50%) shows where A is leading; the red shaded zone (below 50%) where B is leading. End markers: ● circle = A won, ✕ cross = A lost.
Win Probability Overlay: Each distinctly coloured line is one game's pA trajectory - solid lines are games A won, dashed lines are games A lost. The green zone (above 50%) marks where A leads; the red zone (below 50%) where B leads. Circle (●) end markers indicate A victories; cross (✕) markers indicate A losses. The dashed black and grey lines show the average T(G) of the leading and trailing player across all 10 games: the widening gap between them is the engine behind escalating win probabilities.
Absolute Lead Overlay: Overlaid absolute gold leads (A − B) for all 10 games, coloured by the eventual winner (blue = A won, red = B won). Lines crossing zero show a lead change. Notice that the colour of a line often matches the final direction - but not always. Games where a red line ends positive, or a blue line ends negative, indicate comebacks. Because absolute lead grows naturally with total gold in the pool, late-game crossings tend to be rarer and more dramatic.
Relative Lead Overlay: Same 10 games, but showing relative lead (%) - normalised by the trailing player's gold, so early and late rounds are comparable. Lines that stay near zero throughout were genuinely close contests. Lines that shoot up and stay high ended in dominant victories. Multiple crossings of the zero line indicate back-and-forth momentum swings. Because the game-ending hazard is driven by relative lead, games whose relative lead climbs quickly are the ones that tend to end earliest.
With a few batch-simulations our suspicions will slowly solidify. We can now see that as assumed, oftentimes one player will take the lead and ultimately win or the game will be a constant back and forth - this is the typical deterministic account.
However this simulation also reveals, that this is not always the case. Frequently there will be comeback like trajectories, where an initial lead will be lost and the trailing player catches up. This can be seen by a trajectory line crossing the neutral line in the gold lead graphs, or a trajectory going back towards the neutral line in the win probability graph. Finally we should confirm these hypotheses by running thousands of simulations. Even when running 10 games, there is still some variance, in order to understand the essential characteristics and ruling out freak accidents, we need big amounts of data.
Interactive Lab 3: Big Data Simulation
With thousands of simulations, we can compute robust statistics: conditional win rates, survivorship curves, and 2D heatmaps showing how win probability varies with both round number and gold lead.
Warning: Running 100,000 games may take 10-30 seconds depending on your device. The browser may appear frozen but is working. Start with 50,000 games to test performance.
Conditional Win Rate by Round: P(A wins | A holds ≥ X% relative lead at round r), where X is the lead threshold you set. The curve's bell shape is the central finding: mid-game leads (roughly rounds 18–32) are the most predictive of the final outcome. Early leads score lower because the game has many rounds left to swing back. Late-game leads score lower because win chance decreases over time for the leading team because power has saturated, while the trailing team can still catch up.
Win rate by round & relative lead threshold - darker blue = higher A win rate
Win Rate Heatmap: Each cell shows P(A wins | A holds ≥ threshold% lead at that round) - x-axis is round number, y-axis is the lead threshold, and colour intensity maps win probability (darker blue = higher). The brightest band sits in the mid-game columns, confirming the bell curve from the chart above. Moving up (higher thresholds) or pushes cells towards certainty, the gradient from left to right within any threshold row is the clearest visual of how lead-predictiveness builds through the game. While moving right can decrease your win chance, moving up always has a positive effect.
At this point, we can draw some cautious conclusions from the model. These simulations paint a clear picture: having a lead does predict your chance of winning, but it is most predictive in the mid-game. If you are ahead in the mid-game, you often have about an 80% chance of winning the game - and that rises to just under 90% for larger leads. The more surprising result is that the same lead is much less predictive in the early and late game. Only about 60% of games are ultimately won by the team leading at those stages. This entails that leading team win chance decreases over time, while trailing team win chance increases, even if relative lead stays constant.
The story told by the simulations
The above simulations tell a canonical story: Early bouts do not win you the game - they give you an edge over later ones. Imagine a team winning the first few fights and taking an early objective. That gives them more map pressure, better items, and often a level lead by the time the next, more valuable objective appears. In other words, early success helps you contest later success. But if the trailing team manages to take that later objective instead, the swing is often much bigger than the early loss.
Therefore, early leads matter mostly because they help you secure a mid-game lead. And mid-game leads give you the best chance to win. Power gaps are largest here, as you can see by comparing the average T(G) of the leading and trailing teams. At this point, the leading team tends to be close to full power while the trailing team is still climbing. However, when the leading team cannot secure the win, an interesting dynamic emerges:
The Logistic Ceiling: Both teams continue accumulating gold. As the trailing team climbs out of the early-game utility zone of the logistic curve, their T(G) begins to accelerate. Meanwhile, the leading team, already high on the curve, gains diminishing returns. The power gap compresses, the trailing team is essentially the only one still gaining power.
The Comeback Window: Late-game objectives (Baron, Fire Giant) are worth vastly more gold than early ones. A single win here can erase rounds of deficit accumulation. Combined with the flattening of T(G), a trailing team that wins a key late-game fight suddenly finds itself nearly equal in raw power - despite still being behind on the scoreboard.
On average, the trailing team still keeps roughly a 40% win chance even when facing what feels like a nearly secure loss in the 15-20% deficit range.
The Psychological Trap
Here’s where it gets interesting. Once you include a motivation factor that simulates what happens when players give up mentally—treating effective skill as something shaped by motivation, readiness, stress mindset, and fitness—you can model what the 5-minute fallacy actually looks like in play.8910
Effective Skill = Potential Skill × Motivation × Fitness
That framing is not just speculative. Across sport psychology, performance is shaped not only by raw ability but also by negative cognitions, threat appraisals, and perceived readiness.111213 Evidence suggests that a defeatist, “I’ve already lost” mindset can become self‑fulfilling by reducing motivation, effort, and willingness to keep pursuing difficult actions, even when underlying skill is unchanged.
- Self-fulfilling prophecy 1415: Expectations about performance can push outcomes in the same direction.
- Defeatist beliefs reduce goal-directed behaviour 16: Defeatist performance beliefs predict less effort, less progress toward goals, and less pleasure from pursuing them.
- Irrational performance beliefs 1112: Catastrophic thinking about failure increases threat appraisals and can undermine performance under pressure.
Intervention studies also suggest that changing stress mindset can reduce negative affect in competitive settings, even when performance itself is harder to shift in the short term.10
When you drop motivation from 100% to 80% (the mental equivalent of “we’ve already lost”), your effective skill drops by 20% - turning a winnable deficit into a self-fulfilling prophecy of defeat. A full sweep of the model shows that the penalty is often steeper than intuition suggests.
Interactive Lab 4: Demotivation Sweep
This lab holds the game rules fixed, then reruns the full match simulation for every demotivation level from 0% to 100%. At each point, Team A’s effective skill is reduced by that amount and the model runs 100 fresh games, plotting Team A’s average final win rate against demotivation.
This always runs 100 simulations per demotivation point (10,100 total games). Team A's effective skill is set to Potential Skill × (1 − demotivation).
Average Win Rate vs Demotivation: The blue curve shows Team A's average match win rate at each demotivation level. The grey dashed line shows the expected win rate from the effective skill ratio alone - essentially, how much of the outcome you would predict from relative skill before the rest of the game dynamics play out. If the simulated win rate falls even faster, that is the self-fulfilling part: the mental drop is doing more damage than a simple skill-ratio comparison would suggest.
Why This Applies to MOBAs
All MOBAs exhibit the core mechanics this model captures:
- Item caps are real: 6-item full build creates a hard ceiling
- Comeback mechanics exist by design: Gold Fury, Fire Giant, and kill bounties provide catch-up opportunities
- Skill expression remains constant: Your mechanical ability doesn’t diminish because you’re behind - if you are not afflicted by the 5-minute-fallacy
The “5-minute fallacy” is especially common in MOBAs because early gold and level gaps are so visible. But the genre’s design intentionally includes comeback mechanics. Surrendering early cuts against the way these games are built.
Real-World Evidence
Data from Professional League of Legends
Our mathematical model predicts that gold leads follow a logistic advantage curve with high variance in outcomes, and that the impact of advantage diminishes over time. The obvious question is whether this is only a toy-model result, or whether it also appears in real competitive play.
A useful real-world check comes from GameSpot’s analysis of League of Legends Worlds data, which examined how often teams with a gold lead at a given minute actually went on to win the game 17.
Win Rate of Teams With Gold Lead
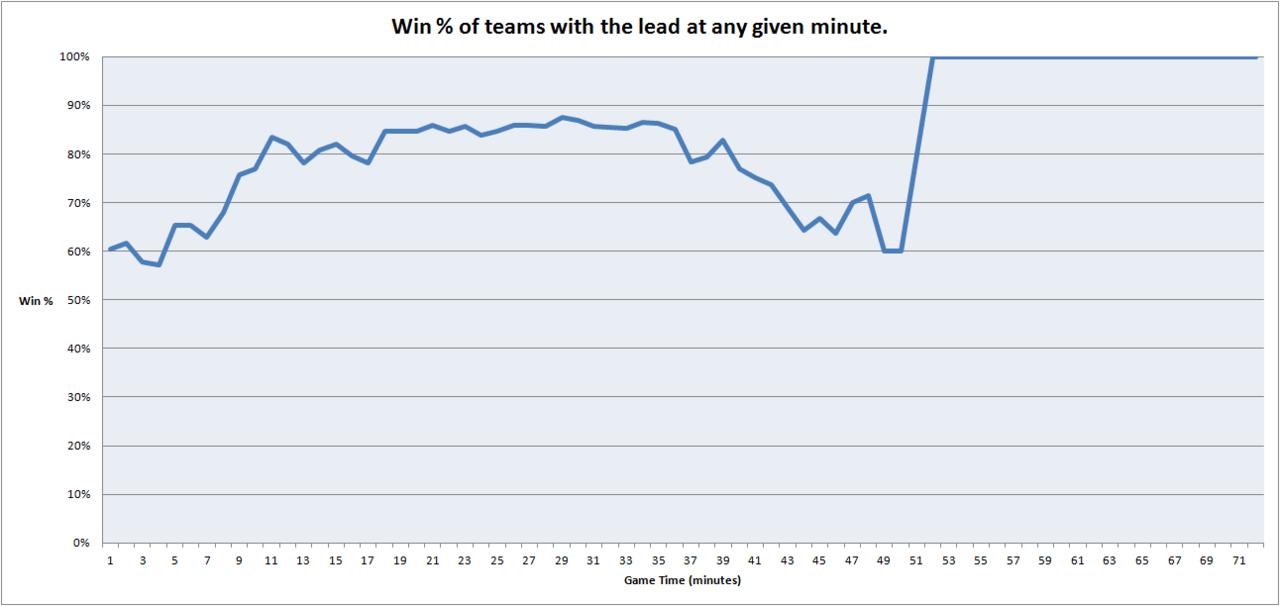
The pattern is strikingly similar to the model:
- Early game (8-11 min): teams with the lead win roughly 70-85% of the time
- Mid game: the lead is most predictive, peaking around 80-85%
- Late game (40+ min): the predictive power falls back toward roughly 60-70%
The important point is not that leads matter - of course they do. The important point is that they never become certainty. Even in professional play, with elite mechanics and coordination, a meaningful fraction of games with a gold lead still end in comebacks.
Gold Lead Required for 90% Win Rate
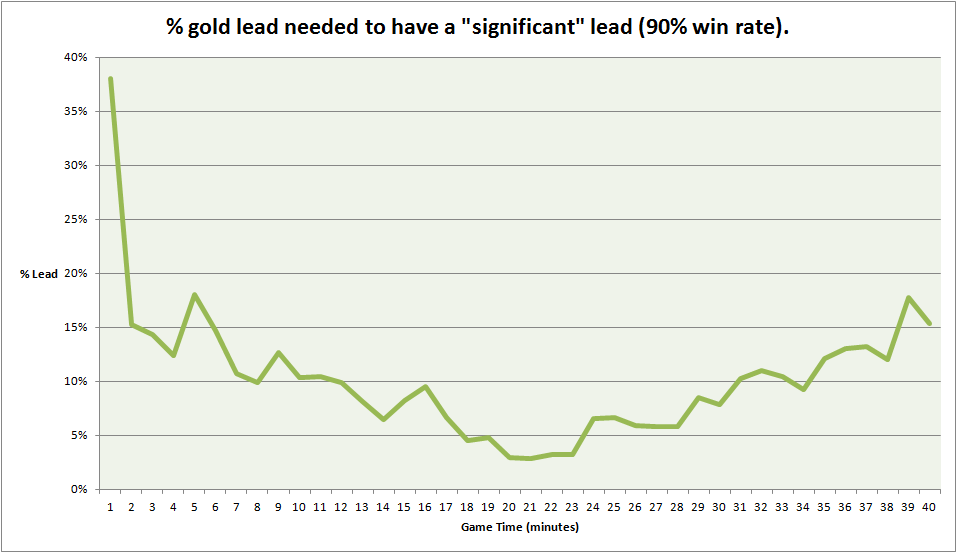
This figure makes another core point of the model visible: advantage must be understood relatively, not absolutely. A lead of 1000 gold is huge when total gold is low, and much less meaningful once both teams are near full build. That is exactly what the logistic interpretation predicts.
Games With a “Significant” Lead Over Time
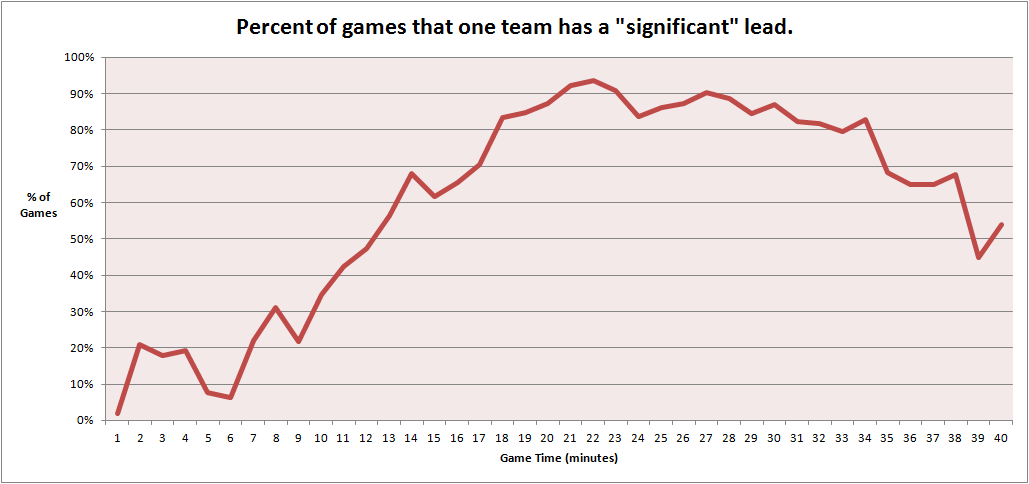
By around 20 minutes, most pro games have developed some meaningful asymmetry. But “one team has a significant lead” is not the same claim as “the outcome is decided.” In fact, the late-game drop suggests that throws, objective swings, and comeback mechanics continue to flatten the practical impact of earlier leads.
What This Validates
The professional data supports the same three claims the model makes:
- Logistic scaling is real: advantage plateaus rather than compounding forever
- Variance remains high: even strong leads still lose a non-trivial share of games
- Late-game equalisation exists: item caps and high-value objectives reopen the game
If even Worlds teams can lose roughly one in five games while ahead, then the idea that a ranked solo-queue game is “already over” at five minutes is statistically indefensible.
“It’s Just Luck, Bro!”
Contingency ≠ Luck
A common dismissal of comeback victories is: “You just got lucky.” But this confuses two very different ideas.
That response also has a self-protective flavor: after disappointing performance, people often reinterpret outcomes in ways that protect self-esteem or shift blame outward.18
- Pure randomness means the outcome is determined by chance alone.
- Contingency means the outcome is hard to predict because many skilled decisions and conditions are interacting at once.
A MOBA is not a coin flip. It is a system where positioning, cooldown tracking, mechanics, macro, morale, and adaptation all interact under uncertainty. That interaction produces variance - but variance is not the same thing as luck.
There is also a deeper problem here — one that goes beyond where you draw the line. The intuition itself is flawed.
Our default assumption is that a lower probability of winning implies a higher contribution of luck when that win occurs. But consider what happens when we test that intuition against actual cases.
Imagine a perfectly even match: identical skill, identical motivation, identical form. Both players are equal in every measurable way, so the win probability sits at exactly 50% each. In this scenario, whoever wins has no edge — by construction, there is nothing else to appeal to. The outcome is as close to pure luck as it is possible to get in a contest between two agents.
Now compare that to a match where the trailing player has a 10% chance of winning. They have held on under pressure, displayed exceptional resilience, and managed to stay in the game long enough for a slight lapse in judgement from the leading player to open a window. The underdog executes a calculated scheme, steals a critical objective, and converts the game. Can that outcome really be attributed to luck more than the even-odds case? It is hard to make that argument with a straight face.
This reveals that our intuition about luck and probability runs backwards in at least some cases. A low-probability win is not necessarily a high-luck win — it may in fact require more deliberate agency, more precise execution, and more sustained effort to produce. We have no principled reason to assume that luck scales with the inverse of probability. The degree to which an outcome should be attributed to luck may be higher, lower, or the same regardless of how likely that outcome was — but it is not simply a function of its improbability.
INUS Conditions
Insufficient but Necessary Parts
Even if we grant that variance plays some role, we still have no reason to treat “luck” as the main explanation of outcome.
In philosophy of causation, an INUS condition is an Insufficient but Necessary part of an Unnecessary but Sufficient condition. That sounds abstract, but the idea is simple: outcomes are caused by multiple contributing factors working together. No single factor alone explains the whole result.
In a MOBA, outcome is better described as:
Outcome = f(Skill, Motivation, Form, Adaptation, Variance)
Each of these can matter:
- Mechanical skill - aim, timing, positioning, combo execution
- Motivation - focus, resilience, willingness to keep trying
- Form - fatigue, stress, confidence, decision speed
- Adaptation - reading enemy habits and changing your plan
- Variance - unpredictability created by all of the above interacting
So if a team wins from a 98%/2% state, why should “luck” automatically be given privileged explanatory status over resilience, cleaner execution, or a better read on the enemy team? It should not.
Case Study: Skill or Luck?
Imagine a simple scenario.
Player A predicts that Player B will move slightly right, and fires an ability there. Player B does move right, and gets hit.
Was that hit skill, or was it luck?
If we repeat that exact setup 100 times:
- if Player A hits 90/100, everyone calls it skill
- if Player A hits 50/100, people suddenly want to call it luck
But that 50% rate may simply reflect two highly skilled players whose decisions are well matched. From A’s perspective, the hit shows a correct read. From B’s perspective, the dodge shows a successful counter-read. The variability comes from the interaction of two skilled agents - not from the absence of skill.
This is why calling a comeback “just luck” is not a helpful explanation. It hides the real contributing causes: prediction, timing, adaptation, execution, and resilience under pressure.
Ultima Facie
Complete Synthesis
Put all of the pieces together, and the central point becomes hard to avoid:
- The mathematical model shows that advantage follows a logistic S-curve, not infinite snowballing
- Monte Carlo simulations show frequent reversals and non-trivial comeback rates
- Skill remains relevant in every round, regardless of whether you are ahead or behind
- Mental state matters because giving up reduces your effective skill and can make the loss self-fulfilling
- Variance is not the same as luck in a skill-based system
- Outcomes are multi-causal, not reducible to one single factor
So the sentence “the game was over at 5 minutes” commits several errors at once:
- It confuses probability with certainty
- It ignores diminishing returns and the flattening effect of item caps
- It actively worsens play by encouraging tilt and disengagement
- It mislabels variance as luck
- It privileges one factor while ignoring the many others that still matter
A more accurate sentence would be:
“The expected outcome is currently a loss.”
That wording is probabilistically cleaner - but it is still strategically unhelpful, because it pushes the mind toward resignation rather than adaptation.
The deeper lesson is this:
The 5-minute surrender fallacy is not merely a statistical error - it is a self-fulfilling prophecy that conflates probability with certainty, variance with luck, and difficulty with impossibility.
The game is not decided at five minutes. Your skill still matters. Your mental state still matters. Your resilience still matters. The only truly lost game is the one where you stop trying.
The Verdict
Game outcomes are not deterministic at five minutes. The logistic nature of advantage ensures that skill remains relevant, comeback windows remain open, and surrendering early mistakes a difficult game for an impossible one.
-
Beato, M., Latinjak, A. T., Bertollo, M., & Boullosa, D. (2025). Confirmation Bias in Sport Science: Understanding and Mitigating Its Impact. International Journal of Sports Physiology and Performance. https://doi.org/10.1123/ijspp.2024-0381 ↩
-
Ittlinger, S., Lang, M., Schubert, M., & Raab, M. (2025). How cognitive biases affect winning probability perception in beach volleyball experts. Scientific Reports. https://doi.org/10.1038/s41598-025-17770-z ↩
-
Kermer, D. A., Driver-Linn, E., Wilson, T. D., & Gilbert, D. T. (2006). Loss Aversion Is an Affective Forecasting Error. Psychological Science, 17(8), 649–653. https://doi.org/10.1111/j.1467-9280.2006.01760.x ↩
-
Zhao, W. J., Walasek, L., & Bhatia, S. (2018). Psychological mechanisms of loss aversion: A drift-diffusion decomposition. Cognitive Psychology. https://doi.org/10.1016/j.cogpsych.2020.101331 ↩
-
Fayomi, A., Majeed, R., Algarni, A., Akhtar, S., Jamal, F., & Nasir, J. (2022). Forecasting Tennis Match Results Using the Bradley-Terry Model. International Journal of Photoenergy. https://doi.org/10.1155/2022/1898132. PDF ↩
-
Johnson, D., & MacKay, N. (2015). Fight the power: Lanchester’s laws of combat in human evolution. Evolution and Human Behavior, 36, 152-163. https://doi.org/10.1016/j.evolhumbehav.2014.11.001. PDF ↩
-
You can probably construct a different model that reliably represents the outlined MOBA properties, but I do believe that all such models are essentially isomorph, and differ only in tuning or specific numerical outcomes (such as explicit win-percentages or similar), but most likely exhibit the same characteristic behaviour. ↩
-
Gontijo, G. M., Ishikawa, V. N., Ichikawa, A. I. T., Bubna, P., Conter, F. da S., de Queiroz, A. C. M., Del Picchia, R., da Silva, D. D., & Uliana Filho, I. I. (2023). Influences of mindset and lifestyle on sports performance: a systematic review. https://doi.org/10.54448/ijn23227 ↩
-
Kaplánová, A. (2024). Psychological readiness of football players for the match and its connection with self-esteem and competitive anxiety. Heliyon, 10(7). https://doi.org/10.1016/j.heliyon.2024.e27608 ↩
-
Mansell, P., Sparks, K., Wright, J., Roe, L., Carrington, S., Lock, J., et al. (2023). “Mindset: performing under pressure” – a multimodal cognitive-behavioural intervention to enhance the well-being and performance of young athletes. Journal of Applied Sport Psychology, 36(4), 623–642. https://doi.org/10.1080/10413200.2023.2296900 ↩ ↩2
-
Mansell, P. C. (2021). Stress mindset in athletes: Investigating the relationships between beliefs, challenge and threat with psychological wellbeing. Psychology of Sport and Exercise, 57, 102020. https://doi.org/10.1016/j.psychsport.2021.102020. PDF ↩ ↩2
-
Jooste, J., Wolfson, S., & Kruger, A. (2022). Irrational Performance Beliefs and Mental Well-Being Upon Returning to Sport During the COVID-19 Pandemic: A Test of Mediation by Intolerance of Uncertainty. Research Quarterly for Exercise and Sport, 94(3), 802–811. https://doi.org/10.1080/02701367.2022.2056117 ↩ ↩2
-
Michel-Kröhler, A., Wessa, M., & Berti, S. (2025). Adverse competition-related cognitions and its relation to satisfaction and subjective performance in athletes. Scientific Reports. https://doi.org/10.1038/s41598-025-16077-3 ↩
-
Madon, S., Jussim, L., & Eccles, J. (1997). In search of the powerful self-fulfilling prophecy.. Journal of personality and social psychology, 72 4, 791-809 . https://doi.org/10.1037/0022-3514.72.4.791. PDF ↩
-
Dalton, B., Maier, S., & Posavac, E. (1977). A self-fulfilling prophecy in a competitive psychomotor task. Motivation and Emotion, 1, 279–289. https://doi.org/10.1016/0092-6566(77)90009-5 ↩
-
Campellone, T., Sanchez, A., Fulford, D., & Kring, A. (2019). Defeatist performance beliefs in college students: Transdiagnostic associations with symptoms and daily goal-directed behavior. Psychiatry Research, 272, 149-154. https://doi.org/10.1016/j.psychres.2018.12.045. PDF ↩
-
GameSpot (2016). How Much Do Gold Leads Matter? Analysis of League of Legends Worlds data. https://www.gamespot.com/articles/how-much-do-gold-leads-matter/1100-6438520/ ↩
-
Hyun, M., Jee, W. F., Wegner, C., Jordan, J. S., Du, J., & Oh, T. (2022). Self-Serving Bias in Performance Goal Achievement Appraisals: Evidence From Long-Distance Runners. Frontiers in Psychology, 13, 762436. https://doi.org/10.3389/fpsyg.2022.762436 ↩